
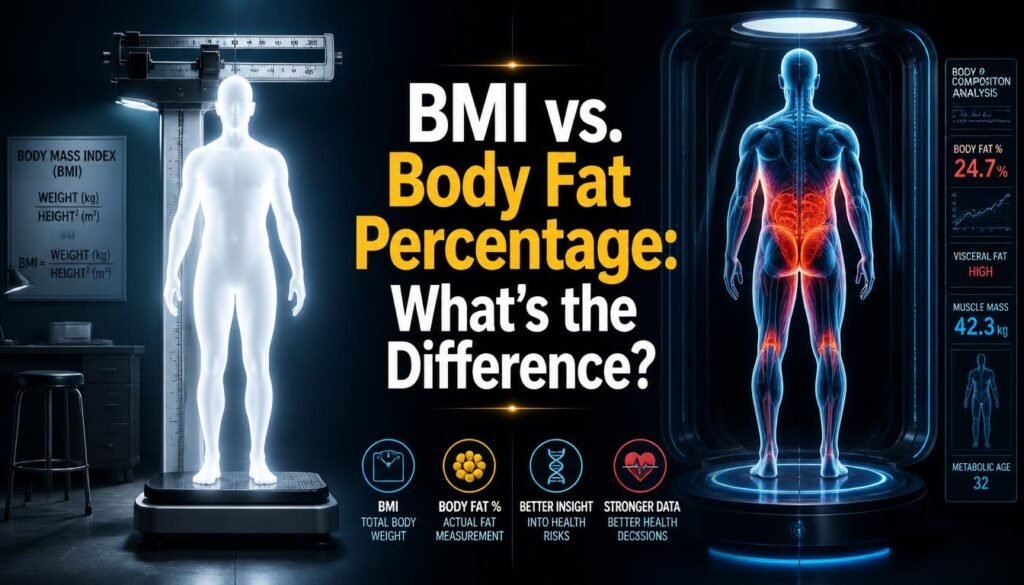
When evaluating your metabolic health, understanding the debate of BMI vs body fat percentage is the critical first step. If you have ever stepped on a scale at a doctor’s office, you have been judged by the Body Mass Index (BMI). Yet, in the modern era of longevity medicine and biohacking, relying solely on this 19th-century mathematical formula is a massive blind spot. The fundamental difference is simple: BMI measures your total mass relative to gravity, while body fat percentage measures the actual tissue composition of your body. One is a blunt statistical instrument; the other is a precise biological metric.
As a clinician focused on metabolic optimization, I see the psychological and physical damage caused by confusing these two metrics every day. Patients restrict calories to achieve a “normal” BMI, inadvertently stripping away vital, metabolically active muscle mass. Meanwhile, others with a “normal” BMI ignore their creeping insulin resistance because the chart tells them they are fine. To truly optimize your biological age, we must dissect the BMI vs body fat percentage argument, understand why standard charts fail, and look at the ideal weight data through the lens of modern science.
Both metrics start from different questions. Here is how BMI is calculated and where it stops being useful.
What is BMI? (The Blunt Instrument)
The Body Mass Index (BMI) was invented in the 1830s by Adolphe Quetelet, a Belgian mathematician—not a physician. He developed the formula (weight in kilograms divided by height in meters squared) to study the physical averages of populations, not to assess the individual health, body fat, or metabolic viability of a single person.
The core difference in the BMI vs body fat percentage debate lies in tissue quality. BMI treats every pound of your body exactly the same. It cannot differentiate between a pound of dense, metabolically active skeletal muscle, a pound of inflammatory visceral fat, a pound of bone mineral, or a pound of intracellular water. Because skeletal muscle is approximately 18% denser than adipose (fat) tissue, a heavily muscled athlete will frequently register as “overweight” or “obese” on the BMI scale, despite having single-digit body fat and pristine cardiovascular health. When comparing BMI vs body fat percentage, BMI is a population-level screening tool that is remarkably poor at predicting individual metabolic reality.
What is Body Fat Percentage? (The Precision Tool)
Body fat percentage is exactly what it sounds like: the total mass of fat divided by total body mass, multiplied by 100. It categorizes your weight into two distinct buckets: fat mass (adipose tissue) and fat-free mass (muscle, bone, water, and organs).
In the BMI vs body fat percentage discussion, body fat percentage is the clear winner for individual accuracy. It tells you exactly what your body is made of. For longevity and metabolic health, the goal is not simply to “lose weight”; the goal is to lose fat mass while preserving or building fat-free mass (specifically skeletal muscle). Muscle is the organ of longevity. It acts as a massive sink for blood glucose, keeping you insulin sensitive, and secretes anti-inflammatory myokines that protect your brain and cardiovascular system.
Optimal Body Fat Ranges for Longevity
While essential fat is required for basic physiological function (hormone production, organ protection, and thermal regulation), excess adipose tissue drives systemic inflammation.
- Men: 10% to 18% is generally considered optimal for metabolic health and athletic performance.
- Women: 20% to 28% is optimal, accounting for the essential sex-specific fat required for reproductive and endocrine health.
BMI vs. Body Fat Percentage: The Core Differences
To visualize exactly why the medical establishment’s reliance on the scale is outdated, refer to this breakdown of the two metrics:
| Feature | Body Mass Index (BMI) | Body Fat Percentage |
|---|---|---|
| What It Measures | Total body weight relative to height. | The ratio of adipose (fat) tissue to lean tissue (muscle, bone, water). |
| Accuracy for Individuals | Low. Frequently misclassifies muscular people and misses “skinny fat” individuals. | High. Directly reflects metabolic health and physical composition. |
| Cost & Accessibility | Free and instant (requires only a scale and stadiometer). | Variable. Ranges from cheap (tape measure/calipers) to expensive (DEXA scans). |
| Best Used For | Tracking obesity trends across massive populations (epidemiology). | Tracking individual body recomposition, fitness progress, and metabolic health. |
| Longevity Value | Poor. Ignores sarcopenia (muscle loss) and visceral fat accumulation. | Excellent. Directly correlates with insulin sensitivity and cardiovascular risk. |
The “Skinny Fat” and “Muscular” Paradoxes
This is where the BMI vs body fat percentage comparison completely breaks down and exposes the danger of standard medical advice.
The Muscular Paradox
Imagine a 30-year-old male who lifts weights heavily, eats a high-protein diet, and sprints twice a week. He is 5’10” and weighs 205 pounds. His BMI is 29.4, categorizing him as “Overweight,” bordering on “Obese.” A standard doctor might tell him to restrict calories and lose 20 pounds. If he follows this advice, he will sacrifice his hard-earned metabolic armor (muscle), crash his testosterone, and lower his basal metabolic rate. His high BMI is driven by dense muscle and bone, not pathology.
The “Skinny Fat” Trap (Normal Weight Obesity)
Now imagine a 45-year-old sedentary office worker who is also 5’10” but weighs 160 pounds. His BMI is 23.0, perfectly “Normal.” The medical system gives him a clean bill of health. However, because he does not lift weights and eats a highly processed diet, he has suffered from sarcopenia (muscle loss) and accumulated a high percentage of visceral fat—the hard, inflammatory fat wrapping around his liver and pancreas. His body fat percentage might be 32%. He is highly insulin resistant and at a severe risk for a cardiac event, yet his BMI tells him he is perfectly healthy. For a deeper dive into this hidden epidemic, read our guide on Visceral Fat vs Subcutaneous Fat: Which One Is Actually Killing You?.
The Ideal Weight Table According to Height and Gender
Despite its flaws, many patients still want a baseline number to aim for. Below is the standard ideal weight table according to height and gender.
Note: The “Standard BMI Range” is unisex and based on a BMI of 18.5 to 24.9. The “Hamwi Ideal Baseline” is a historical clinical formula (1964) that estimates a target weight based on gender and frame size, originally used for drug dosing and nutritional baselines.
| Height | Standard “Normal” BMI Range (Unisex) | Hamwi Ideal Baseline (Men) | Hamwi Ideal Baseline (Women) |
|---|---|---|---|
| 5’0″ | 95 – 127 lbs | 106 lbs | 100 lbs |
| 5’2″ | 101 – 136 lbs | 118 lbs | 110 lbs |
| 5’4″ | 108 – 145 lbs | 130 lbs | 120 lbs |
| 5’6″ | 115 – 154 lbs | 142 lbs | 130 lbs |
| 5’8″ | 122 – 163 lbs | 154 lbs | 140 lbs |
| 5’10” | 129 – 173 lbs | 166 lbs | 150 lbs |
| 6’0″ | 137 – 183 lbs | 178 lbs | 160 lbs |
| 6’2″ | 145 – 194 lbs | 190 lbs | 170 lbs |
Add 10% to the Hamwi baseline for a large bone frame; subtract 10% for a small frame.
Before we look at the data, remember that the BMI vs body fat percentage argument heavily favors the latter. Use this ideal weight table according to height and gender only as a rough statistical baseline. If you are a woman who lifts heavy weights, your healthy, optimal weight will likely sit above the Hamwi baseline and near the top (or slightly above) the Standard BMI range due to increased muscle mass and bone mineral density. If you are an older adult, aiming for the lower end of these charts is a longevity mistake, as you need metabolic reserve to protect against frailty.

How to Measure Body Fat Percentage Accurately
If you are tracking BMI vs body fat percentage, you will notice that body fat is slightly harder to measure than simply stepping on a scale. However, the data you get is infinitely more valuable. Here are the most common methods, ranked from most to least accurate:
- DEXA Scan (Dual-Energy X-ray Absorptiometry): The gold standard. It uses low-level X-rays to differentiate between bone mineral, lean tissue, and fat tissue, while also showing exactly where your fat is stored (visceral vs. subcutaneous).
- Hydrostatic Weighing & Bod Pod: Highly accurate clinical methods that measure body density through water displacement or air plethysmography.
- Skinfold Calipers: When performed by a highly trained professional, measuring the thickness of subcutaneous fat at 3 to 7 specific sites on the body yields excellent, highly reproducible results.
- The U.S. Navy Circumference Method: A highly accessible mathematical formula that uses your height, neck, waist, and hip circumferences to estimate body fat. Use our advanced Body Fat Calculator to calculate this instantly at home.
- Bioelectrical Impedance Analysis (BIA): Found in smart scales and handheld devices. It sends a weak electrical current through your body. While convenient, it is highly inaccurate and heavily influenced by your daily hydration levels and recent carbohydrate intake.
Shifting the Focus: Muscle Mass and Metabolic Health
When deciding between BMI vs body fat percentage for your daily tracking, you must realize that neither metric tells the whole story if you ignore muscle function. You can have a low body fat percentage but still be metabolically fragile if you lack functional strength.
Muscle is not just about aesthetics; it is your metabolic armor. As you age, preserving lean mass becomes your primary defense against metabolic disease, falls, and physical frailty. Ensure you are eating enough to support this vital tissue by using our Protein Intake Calculator. Furthermore, maintaining functional strength is a better predictor of your lifespan than your weight or your body fat percentage; learn how to test this in our article Grip Strength & Longevity: The Simple Test That Predicts How Long You’ll Live.
To fuel this muscle and optimize your body composition, you must understand your true daily energy expenditure. Use our TDEE Calculator to find your baseline, and implement strategic intermittent fasting using our Intermittent Fasting Calculator to lower baseline insulin and trigger cellular autophagy.
Final Thoughts
Ultimately, the BMI vs body fat percentage debate is settled in longevity medicine. BMI is a relic of 19th-century statistics that fails to account for the profound complexities of human tissue, hormonal health, and metabolic flexibility. Body fat percentage is a vastly superior metric that respects the difference between inflammatory fat and protective muscle.
However, do not become paralyzed by the numbers. Stop obsessing over BMI vs body fat percentage charts and start measuring what truly matters. Measure your waist-to-height ratio, test your grip strength, lift heavy weights, and monitor your fasting insulin. By shifting your focus from total weight to tissue quality and metabolic function, you take true control of your healthspan and ensure that your later years are defined by vitality, independence, and resilience.
Frequently Asked Questions (FAQ)
1. What is the main difference in BMI vs body fat percentage?
The main difference is that BMI only measures your total body weight relative to your height, treating all tissue equally. Body fat percentage measures the actual ratio of adipose (fat) tissue to lean mass (muscle, bone, and water), providing a highly accurate picture of your metabolic health and body composition.
2. Which is more accurate: BMI vs body fat percentage?
Body fat percentage is vastly more accurate for individual health assessment. BMI frequently misclassifies heavily muscled individuals as “overweight” and misses “skinny fat” individuals who have a normal weight but dangerous levels of visceral fat and low muscle mass.
3. What is a healthy body fat percentage for men and women?
For optimal metabolic health and longevity, a healthy body fat percentage is generally 10% to 18% for men, and 20% to 28% for women. Women require a higher essential fat percentage to support reproductive health, hormonal balance, and bone density.
4. Is the ideal weight table according to height and gender accurate?
Standard ideal weight tables (based on BMI or the Hamwi formula) are only rough statistical baselines. They do not account for your individual muscle mass, bone frame size, or age. A muscular individual or an older adult needing metabolic reserve will often be healthiest at a weight higher than these charts suggest.
5. How can I measure my body fat percentage at home?
The most accessible and reasonably accurate at-home method is the U.S. Navy Circumference Method, which uses a tape measure to calculate body fat based on your height, neck, waist, and hip circumferences. Skinfold calipers are also highly effective if used by a trained professional.
⚕️ Medical Disclaimer
The content provided on RegenStep.com, including this guide authored by Dr. Julian Vance, is strictly for educational and informational purposes only. It is not intended to be a substitute for professional medical advice, diagnosis, or treatment.
Body composition metrics, including BMI, body fat percentage, and ideal weight tables, are screening tools and do not diagnose specific medical conditions. Always consult with your physician or a registered dietitian before beginning any new weight management, diet, or exercise program, particularly if you have a history of eating disorders, metabolic disease, or cardiovascular conditions.
What is the main difference in BMI vs body fat percentage?
The main difference is that BMI only measures your total body weight relative to your height, treating all tissue equally. Body fat percentage measures the actual ratio of adipose (fat) tissue to lean mass (muscle, bone, and water), providing a highly accurate picture of your metabolic health and body composition.
Which is more accurate: BMI vs body fat percentage?
Body fat percentage is vastly more accurate for individual health assessment. BMI frequently misclassifies heavily muscled individuals as “overweight” and misses “skinny fat” individuals who have a normal weight but dangerous levels of visceral fat and low muscle mass.
What is a healthy body fat percentage for men and women?
For optimal metabolic health and longevity, a healthy body fat percentage is generally 10% to 18% for men, and 20% to 28% for women. Women require a higher essential fat percentage to support reproductive health, hormonal balance, and bone density.
Is the ideal weight table according to height and gender accurate?
Standard ideal weight tables (based on BMI or the Hamwi formula) are only rough statistical baselines. They do not account for your individual muscle mass, bone frame size, or age. A muscular individual or an older adult needing metabolic reserve will often be healthiest at a weight higher than these charts suggest.
How can I measure my body fat percentage at home?
The most accessible and reasonably accurate at-home method is the U.S. Navy Circumference Method, which uses a tape measure to calculate body fat based on your height, neck, waist, and hip circumferences. Skinfold calipers are also highly effective if used by a trained professional.

Julian Vance is the writer and editor behind RegenStep, translating peer-reviewed longevity, metabolic, and gut-health research into practical, actionable guides. Julian is not a licensed physician; content is reviewed against cited primary sources and is for informational purposes only. Always consult a qualified healthcare provider for personal medical advice.