
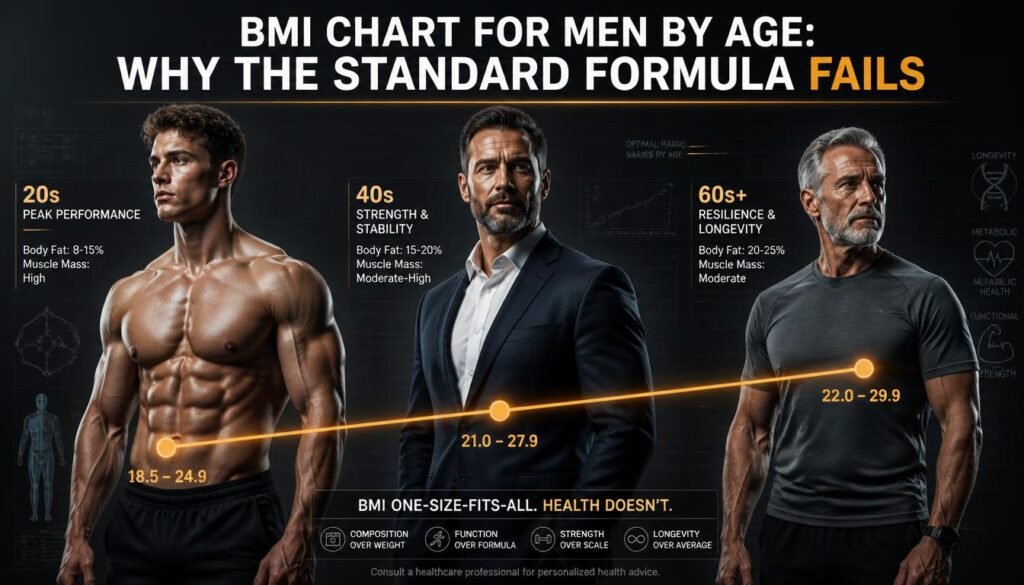
If you search for a BMI chart for men by age, you will quickly notice a glaring biological omission: the standard chart does not actually change with age. According to the CDC and the World Health Organization, a “normal” BMI for a 25-year-old male is the exact same 18.5 to 24.9 range as it is for a 75-year-old male. But as a physician focused on longevity, metabolic health, and male hormone optimization, I can tell you that treating these two men identically is a massive clinical error. Your hormonal landscape, your muscle density, and your metabolic risk shift dramatically across the decades, and the way you interpret your weight must shift with them.
In this comprehensive guide, I will break down the standard BMI chart for men by age, explain why the truly healthy target range quietly widens as you get older, and give you the superior metrics—like waist-to-height ratio, body fat percentage, and grip strength—that actually predict your healthspan. If you are tired of a static, 19th-century scale judging your dynamic male biology, this is the age-aware framework you need to optimize your physical prime and protect your later years.
Before reading the chart, see how the BMI number is produced and what it leaves out.
The Standard BMI Chart for Men by Age (And the Longevity-Adjusted View)
The standard BMI chart for men by age used in nearly every American clinic is based on a single, static formula: weight in kilograms divided by height in meters squared. The CDC defines a “normal” BMI as 18.5 to 24.9 for all adults, regardless of age or sex. However, modern longevity research and gerontology tell a much more nuanced story. As men age, testosterone declines, muscle mass naturally decreases (sarcopenia), and a slightly higher BMI actually becomes protective against frailty and acute mortality.
Below is the standard chart, paired with the longevity-adjusted targets and optimal body fat ranges I use in clinical practice for male optimization:
| Age Group | Standard “Normal” BMI (CDC) | Longevity-Adjusted Healthy Target | Optimal Body Fat % |
|---|---|---|---|
| 20 – 29 | 18.5 – 24.9 | 21.0 – 25.0 | 8% – 19% |
| 30 – 39 | 18.5 – 24.9 | 22.0 – 26.0 | 10% – 21% |
| 40 – 49 | 18.5 – 24.9 | 23.0 – 27.0 | 11% – 23% |
| 50 – 59 | 18.5 – 24.9 | 24.0 – 27.5 | 12% – 24% |
| 60 – 69 | 18.5 – 24.9 | 25.0 – 28.0 | 13% – 25% |
| 70 + | 18.5 – 24.9 | 25.0 – 28.5 | 14% – 26% |
Notice the critical divergence: while the CDC column never changes, the longevity-adjusted column drifts upward. This is not an excuse to let your health slide; it is a recognition of male physiology. A BMI of 27 in a 68-year-old man often reflects protective metabolic reserve and preserved structural mass, whereas the exact same number in a sedentary 25-year-old may signal dangerous visceral fat accumulation. For a deeper breakdown of why the generic formula fails male biology, read our guide: The BMI Calculator for Men is Broken: Why Standard Metrics Fail Male Biology.
Why the Healthy BMI Range Shifts as Men Age
To understand why a static BMI chart for men by age is clinically incomplete, we must look at what happens to male body composition and endocrinology across the lifespan. Three massive physiological shifts drive the divergence between the standard chart and biological reality.
1. The 20s and 30s: Peak Testosterone and Muscle Density
In your 20s and early 30s, your testosterone levels are at their lifetime peak. Your body is highly primed to synthesize protein and build dense skeletal muscle. During this stage, the standard BMI chart for men by age is at its most inaccurate for active men. Because skeletal muscle is roughly 18% denser than adipose (fat) tissue, men who engage in heavy resistance training will easily push their BMI into the “overweight” (25.0 – 29.9) category.
If a 28-year-old powerlifter looks at the BMI chart for men by age, the chart tells him he is unhealthy and needs to lose weight. If he follows this advice and restricts calories, he will sacrifice his hard-earned metabolic armor, crash his endocrine system, and lower his basal metabolic rate. His high BMI is driven by dense muscle and bone mineral density, not pathology.
2. The 40s: The Cortisol Shift and Visceral Accumulation
As you enter your 40s, a silent shift occurs. Testosterone levels begin to decline by roughly 1% per year, while life and career stress peak, driving up baseline cortisol. This specific hormonal intersection drastically reduces your carbohydrate tolerance and changes where your body stores energy.
Fat storage begins migrating from the subcutaneous layer (under the skin) to the visceral cavity—wrapping tightly around your liver, pancreas, and intestines. During this decade, your total weight might barely change, keeping you safely in the “normal” range of the BMI chart for men by age. But underneath the surface, you are developing the classic “dad bod” phenotype: low muscle mass and high visceral fat. This is a metabolic time bomb. Visceral fat acts as an active endocrine organ, pumping out inflammatory cytokines that drive insulin resistance and heart disease. Managing stress becomes a metabolic necessity; learn how in Cortisol Belly Fat: Why Stress Hormones Stop You From Losing Weight.
3. The 50s and Beyond: Sarcopenia and the Obesity Paradox
After age 50, the primary threat to male longevity is no longer just fat gain; it is sarcopenia—the age-related, accelerated loss of skeletal muscle mass. Simultaneously, you begin losing bone mineral density, and your height may shrink slightly due to spinal disc compression. Because height is the denominator in the BMI equation, losing an inch of height artificially inflates your BMI, even if your weight remains completely stable.
This is where the “obesity paradox” emerges in male gerontology. Extensive epidemiological research shows that for men over 65, a slightly higher BMI (25.0 to 27.5) is associated with lower all-cause mortality than a “normal” BMI of 22.0. Older men need metabolic and structural reserve to survive acute catabolic stressors like pneumonia, major surgery, or severe infections. Furthermore, extra mass in older age often correlates with a lower risk of fatal falls and hip fractures. Forcing a 72-year-old man to diet down to a BMI of 21 strips him of his biological armor and accelerates frailty.
The 3 Blind Spots of the BMI Chart for Men by Age
Relying exclusively on the standard BMI chart for men by age leaves three critical variables completely invisible to you and your doctor:
- The “Skinny Fat” Trap (Normal Weight Obesity): A man can hold a “normal” BMI of 23 while carrying dangerous levels of visceral fat and suffering from severe muscle wasting. The chart gives him a clean bill of health while his fasting insulin and triglycerides quietly climb into the danger zone. Understand the difference in Visceral Fat vs Subcutaneous Fat: Which One Is Actually Killing You?.
- Muscle Mass and Bone Density: The formula cannot distinguish between a pound of dense, glucose-disposing muscle and a pound of inflammatory fat. Men who resistance train are routinely penalized by the math.
- Height Loss and Spinal Compression: Post-50 men naturally lose height. This skews the height-based denominator of the formula, making older men appear heavier on the chart than their actual tissue mass dictates.
Better Metrics to Track at Every Stage
Instead of letting a static chart dictate your health strategy, adopt the functional metrics that actually reflect your biological age. Here is what to prioritize at each life stage:
| Life Stage | Primary Hormonal Driver | What the BMI Chart Misses | The Superior Metric to Track |
|---|---|---|---|
| 20s – 30s | Peak Testosterone | Athletic muscle mass misclassified as fat. | Body Fat % (target 8-19%) & Fat-Free Mass Index (FFMI). |
| 40s | T-Decline / High Cortisol | Silent visceral fat migration & insulin resistance. | Waist-to-Height Ratio (keep < 0.5) & Fasting Insulin. |
| 50s – 60s | Lower T / Sarcopenia onset | Muscle wasting masked by stable weight. | Grip Strength, DEXA Scan (for lean mass & bone density). |
| 70 + | Low T / Frailty risk | Lack of metabolic reserve for acute illness. | Gait speed, functional independence, & muscle preservation. |
Functional strength is one of the most powerful predictors of how long—and how well—you will live, vastly outperforming weight metrics. Learn how to test it in Grip Strength & Longevity: The Simple Test That Predicts How Long You’ll Live.
Your Action Plan by Decade
Knowing how to read the BMI chart for men by age is only useful if you pair it with the right physiological interventions. Here is your decade-specific protocol:
In Your 20s and 30s: Build metabolic armor. Your primary goal should be maximizing skeletal muscle mass. Muscle is the organ of longevity; it acts as a massive sink for blood glucose, keeping you insulin sensitive for decades. Do not fear the “overweight” BMI category if it is driven by lean tissue. Use our Protein Intake Calculator to ensure you are consuming enough amino acids to support hypertrophy, and our Body Fat Calculator to track true composition instead of scale weight.
In Your 40s: Defend your insulin sensitivity and manage cortisol. This is the decade to tighten your carbohydrate tolerance, prioritize deep sleep, and lift heavy weights to counteract the natural drop in testosterone. Use our TDEE Calculator to establish your true energy expenditure, and consider time-restricted eating with our Intermittent Fasting Calculator to keep fasting insulin between 2 and 5 μIU/mL and strip away visceral fat.
In Your 50s and 60s: Protect muscle and bone above all else. Sarcopenia is the enemy. Prioritize protein at every meal, engage in heavy axial loading (squats, deadlifts, farmer’s carries) to stimulate bone mineral density, and get a DEXA scan to monitor your lean mass. Do not chase the lower end of the BMI chart; chase strength and a tight waistline.
In Your 70s and Beyond: Preserve your reserve. Avoid extreme caloric restriction or aggressive weight loss diets entirely. Your goal is functional independence—carrying heavy groceries, climbing stairs without breathlessness, and recovering quickly from illness. A slightly higher BMI is your ally here, provided your waist-to-height ratio remains in check.

Final Thoughts
The standard BMI chart for men by age is a useful population-level screening tool for epidemiologists, but it is a terrible individual diagnostic instrument for men serious about their healthspan. It ignores the protective power of muscle in your youth, the visceral migration driven by stress in your 40s, and the vital metabolic reserve you need to survive the physical insults of your later years.
Calculate your number to establish a baseline, then immediately pivot to the metrics that actually matter: your waist-to-height ratio, your body fat percentage, your fasting blood markers, and your functional grip strength. Your biology is a dynamic, hormone-driven engine that evolves with every decade. Treat it with the nuance it deserves, stop trusting a 19th-century division problem, and take true control of your longevity.
Frequently Asked Questions (FAQ)
1. Does the BMI chart for men by age change after 40?
The official CDC BMI chart does not change with age; a “normal” BMI remains 18.5 to 24.9 for all adult men. However, longevity research shows that the healthiest target range shifts upward after 40 due to natural muscle loss, hormonal changes, and the protective metabolic reserve needed to survive acute illnesses in later life.
2. What is a healthy BMI for a 60-year-old man?
While the standard chart defines normal as 18.5 to 24.9, a healthy BMI for a 60-year-old man often sits between 25.0 and 27.5. This phenomenon, known as the “obesity paradox,” occurs because older men need extra structural and metabolic reserve to protect against frailty, bone fractures, and severe infections.
3. What is a normal body fat percentage for men by age?
Healthy body fat ranges rise slightly with age: 8-19% for men in their 20s, 11-22% for men in their 40s, and 13-25% for men over 60. Attempting to maintain the extremely low body fat of your 20s into your 60s can crash testosterone levels and accelerate dangerous muscle wasting.
4. Why does my BMI increase as I get older even if my weight stays the same?
As men age, they naturally lose height due to spinal disc compression and postural changes. Because height is the denominator in the BMI equation, losing an inch of height will artificially inflate your BMI, making you appear heavier on the chart even if your actual weight remains completely stable.
5. Is the BMI chart accurate for men who lift weights?
No. The BMI chart cannot differentiate between dense muscle mass and fat mass. Men who engage in heavy resistance training frequently register as “overweight” or “obese” on the standard chart despite having optimal body fat percentages, excellent insulin sensitivity, and superior cardiovascular health.
⚕️ Medical Disclaimer
The content provided on RegenStep.com, including this guide authored by Dr. Julian Vance, is strictly for educational and informational purposes only. It is not intended to be a substitute for professional medical advice, diagnosis, or treatment.
Body composition metrics, including BMI, body fat percentage, and waist-to-height ratios, are screening tools and do not diagnose specific medical conditions. The longevity-adjusted targets discussed here are educational interpretations of current research and should not replace individualized clinical guidance. Always consult with your physician or a qualified healthcare provider before beginning any new weight management, diet, or exercise program, particularly if you have a history of cardiovascular disease, metabolic syndrome, or hormonal imbalances.
Does the BMI chart for men by age change after 40?
The official CDC BMI chart does not change with age; a “normal” BMI remains 18.5 to 24.9 for all adult men. However, longevity research shows that the healthiest target range shifts upward after 40 due to natural muscle loss, hormonal changes, and the protective metabolic reserve needed to survive acute illnesses in later life.
What is a healthy BMI for a 60-year-old man?
While the standard chart defines normal as 18.5 to 24.9, a healthy BMI for a 60-year-old man often sits between 25.0 and 27.5. This phenomenon, known as the “obesity paradox,” occurs because older men need extra structural and metabolic reserve to protect against frailty, bone fractures, and severe infections.
What is a normal body fat percentage for men by age?
Healthy body fat ranges rise slightly with age: 8-19% for men in their 20s, 11-22% for men in their 40s, and 13-25% for men over 60. Attempting to maintain the extremely low body fat of your 20s into your 60s can crash testosterone levels and accelerate dangerous muscle wasting.
Why does my BMI increase as I get older even if my weight stays the same?
As men age, they naturally lose height due to spinal disc compression and postural changes. Because height is the denominator in the BMI equation, losing an inch of height will artificially inflate your BMI, making you appear heavier on the chart even if your actual weight remains completely stable.
Is the BMI chart accurate for men who lift weights?
No. The BMI chart cannot differentiate between dense muscle mass and fat mass. Men who engage in heavy resistance training frequently register as “overweight” or “obese” on the standard chart despite having optimal body fat percentages, excellent insulin sensitivity, and superior cardiovascular health.

Julian Vance is the writer and editor behind RegenStep, translating peer-reviewed longevity, metabolic, and gut-health research into practical, actionable guides. Julian is not a licensed physician; content is reviewed against cited primary sources and is for informational purposes only. Always consult a qualified healthcare provider for personal medical advice.